The 2023 Certificate of Secondary Education results showed 17,691 students failed the exams, which the education ministry attributed to tight control over malpractices compared with the previous years. Overall, 45,666 candidates registered for the SSCSE exams, with 28,038 males and 16,628 females in 500 schools across the country.
Writer: Makur Majeng
South Sudan’s Ministry of General Education and Instruction (MoGEI) on 8th August 2024 announced that only 26,440 candidates passed with a rate of 59.9% out of 44,131 candidates who fully sat for the 2023 Certificate of Secondary Education.
The exam was conducted from the 4th to the 16th of December 2023 according to the National Examinations Council’s calendar.
The National Examinations Council (NEC) noted that out of 45,666 candidates registered for the exams across the country, 966 candidates did not turn up for the examination, 291 did not complete exams, 8 did not follow exam registration criteria, and 28 cheating cases were recorded. These made the candidates’ results incomplete, cancelled, and not graded.
Data Source: Ministry of General Education and Instruction
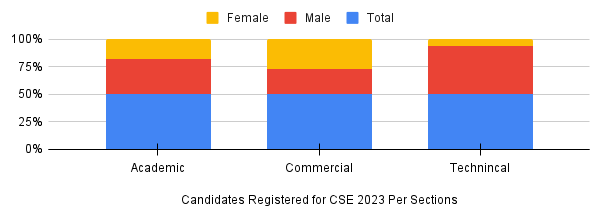
The candidates that sat for the 2023 NEC exams were registered under different sections, whereby 45,433 candidates registered under the academic section, with 28,878 male and 16,555 female, 107 candidates were registered under the commercial section with 49 male and 58 female, and 126 registered for the technical section with 111 male and 15 female.
Data Source: Ministry of General Education and Instruction
NEC indicated that out of 45,666 candidates, 44,131 were successfully graded, with 27,897 male and 16,234 female, representing 63.2% and 36.8%, respectively.
In addition to that, out of 44,131, 26,440 candidates obtained a mean grade of C plain and above which qualified them for university entry, with 16,633 male and 9,807 female. However, 17,692 with 11,264 male and 6,427 female candidates failed the examinations.
“Out of the 44,131 candidates, 26,440 (16,633 males, 9,807 females) managed to obtain the minimum university entry qualification (mean grade of C and above) and hence qualify for progression to universities, while 17,691 (11, 264 males, 6,427 females) could not make it, unfortunately. This represents a pass rate of 59.9% (at least C plain), which indicates a decline compared to the pass rate of 95.3% in 2022. This decline can be attributed to controlled exam malpractices in the 2023 CSE Examinations,” said Awut Deng Achuil, Minister of General Education and Instruction, during the release of the results.
Data Source: Ministry of General Education and Instruction
In comparison with the previous year, the pass rate in 2023 has plummeted by 35.4% from 95.3% in 2022 and this marks the lowest pass rate recorded.
Data Source: Ministry of General Education and Instruction
Data Source: Ministry of General Education and Instruction
Conclusion:
The 2023 South Sudan Certificate of Secondary has been marked by a 35.4% decline compared with the previous year, 2022 where candidates’ performance was recorded at 95.3%. The Ministry of Education attributed the decline to controlled exam malpractices where exams were not leaked as well as candidates being unable to cheat.
To ensure accuracy and transparency, we at 211 Check welcome corrections from our readers. If you spot an error in this article, please request a correction using this form. Our team will review your request and make the necessary corrections immediately, if any.
Fighting misinformation and disinformation in the media is crucial to avoiding fake news. Don’t share content you’re uncertain about. False information can harm and mislead people, risking their lives—Fact-check before sharing. For more details, visit https://211check.org/ or message us on WhatsApp at +211 917 298 255. #FactsMatter.
https://211check.org/wp-content/uploads/2024/08/211-Check-Website-Graphics-NEC-Results.png218600211 Checkhttps://211check.org/wp-content/uploads/2020/03/211Check_logo-1-300x120.png211 Check2024-08-20 13:32:572024-08-21 08:02:07The National Examinations Council records a 35.4% pass rate decline in the 2023 Certificate of Secondary Education Results
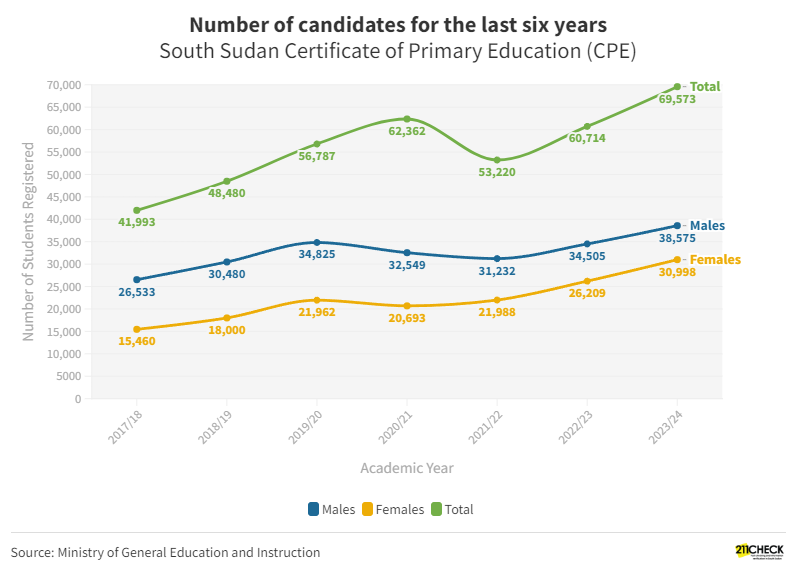
The previous year, 60,714 enrolled for the exams, comprising 34,505 males and 26,209 females. This year, 69,573 candidates, 38,575 males and 30,998 females, registered.
The Acting Minister of the Ministry of General Education and Instruction, Martin Tako Moyi, said in a press statement on 18 October 2023 that 69,573 candidates, 38,575 males and 30,998 females, have dully registered for the examination, which began on Monday, 20 November 2023.
However, compared to the previous year, when 60,714 candidates, including 34,505 males and 26,209 females, registered, this year’s number shows a 14.59 per cent increase in the number of candidates.
Male candidates increased by 4,070 from 34,505 in the 2022/23 exams, and female candidates also grew by 4,789 from 26,209 the previous year.
The increase in male candidates accounts for 11.80% of the rise, while the increase in female candidates accounts for 18.27%.
2017 – 2023
Year
Males
Females
Total
2017/18
26,533
15,460
41,993
2018/19
30,480
18,000
48,480
2019/20
34,825
21,962
56,787
2020/21
32,549
20,693
53,242
2021/22
31,232
21,988
53,220
2022/23
34,505
26,209
60,714
2023/24
38,575
30,998
69,573
Table showing statistics of CPE candidates for the past six years
Table showing the number of Candidates and Examination Centers by State and Administrative Areas
S/No
State/Area
Number of Candidates
Number of Schools
Abyei Administrative Area
1,035
19
Central Equatoria State
19,325
428
Northern Bahr-el-Ghazal State
7,536
227
Ruweng Administrative Area
4,093
37
Warrap State
7,577
175
Unity State
3,616
41
Western Equatoria State
3,813
128
Western Bahr-el-Ghazal State
4,489
127
Upper Nile State
5,180
103
Lakes State
4,944
139
Greater Pibor Administrative Area
145
5
Jonglei State
3,076
80
Eastern Equatoria State
3,952
155
Egypt
789
23
Conclusion:
The increase in candidates highlights the need for adequate infrastructure and resources to accommodate the growing student population. The government should prioritise investment in schools, classrooms, textbooks, and other learning materials to ensure all students have access to quality education. While the number of female candidates has increased, there is still a gender disparity, with more male candidates than female candidates. Efforts should be made to encourage and support girls’ education, including providing scholarships, addressing cultural barriers, and promoting female role models in education.
Well-trained and motivated teachers are essential for providing quality education. The government should invest in teacher training programs, provide competitive salaries and benefits, and create a supportive working environment to attract and retain qualified teachers. The curriculum should be regularly reviewed and updated to ensure its relevance and effectiveness. Innovative teaching methods, such as incorporating technology and interactive learning, should be adopted to engage students and enhance their learning experience. South Sudan has been plagued by conflict, which has disrupted education for many children. Efforts should be made to increase access to education in conflict-affected areas, including providing safe learning spaces, recruiting and training teachers, and ensuring the availability of learning materials.
To ensure accuracy and transparency, we at 211 Checkwelcome corrections from our readers. If you spot an error in this article, please request a correction using this form. Our team will review your request and make the necessary corrections immediately, if any.
Fighting misinformation and disinformation in the media is crucial to avoiding fake news. Don’t share content you’re uncertain about. False information can harm and mislead people, risking their lives—Fact-check before sharing. For more details, visit https://211check.org/ or message us on WhatsApp at +211 917 298 255. #FactsMatter.
https://211check.org/wp-content/uploads/2023/11/Number-of-CPE-candidates-for-the-last-five-years.png575796211 Checkhttps://211check.org/wp-content/uploads/2020/03/211Check_logo-1-300x120.png211 Check2023-11-03 10:07:022023-11-04 09:13:59Data Story: 14.59% rise in pupils registered for the certificate of primary education examinations this year
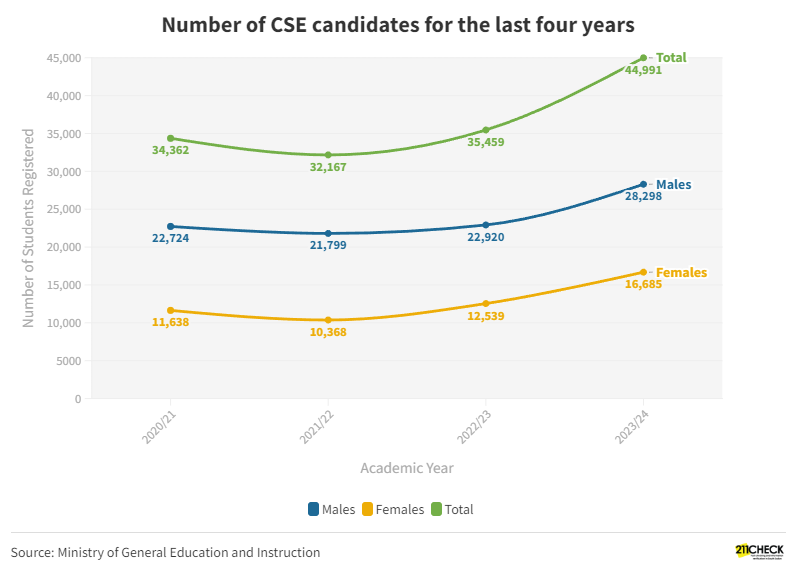
44,991 candidates registered for the South Sudan Certificate of Secondary Education (SSCSE) exams in 2023, with 28,298 males and 16,685 females. Last year, 35,459 candidates registered, 22,920 males and 12,539 females.
Writer: Emmanuel Bida Thomas
South Sudan’s Ministry of General Education and Instruction announced on 18th October 2023 the schedule for the 2023 Certificate of Secondary Education (CSE) Examinations, which will take place from 4th December to 14th December 2023.
According to Martin Tako Moyi, Acting Minister of General Education and Instruction, 44,991 candidates have registered for the 2023 academic year exams. There are 16,685 females and 28,298 males among them.
However, compared to the previous year, when 35,459 candidates enrolled for the South Sudan Certificate of Secondary Education examination (SSCSE), including 22,920 males and 12,539 females, this year’s total number of candidates registered represents a 26.88% increase, the highest since the establishment of the National Examination Council.
Male candidates increased by 5,378 from 22,920 in the 2022 exams, and female candidates also increased by 4,146 from 12,539 the previous year.
Year
Males
Females
Total
2020/21
22,724
11,638
34,362
2021/22
21,799
10,368
32,167
2022/23
22,920
12,539
35,459
2023/24
28,298
16,685
44,991
Table showing the number of CSE candidates for the last three years
Martin Tako Moyi, Acting Minister of General Education and Instruction, attributes the rise in the number of candidates this academic year to the establishment of one hundred (100) new secondary schools across the country. He also said that many refugee students registered for the examinations.
“The number of schools increased by 100 (10%) compared to 400 schools registered in 2022 CSE examinations. The Refugee candidates also increased by 119 candidates (13.95%),” he said.
Table showing the number of Candidates and Examination Centers by State and Administrative Areas
S/No
State/Area
Number of Candidates
Number of Examination Centers
Abyei Administrative Area
504
5
Jonglei State
1,798
24
Lakes State
2,314
17
Unity State
1,178
24
Pibor Administrative Area
87
2
Eastern Equatoria State
2,747
39
Ruweng Administrative Area
1,843
20
Western Equatoria State
1,691
39
Central Equatoria State
17,226
176
Northern Bahr-el-Ghazal State
2,759
37
Western Bahr-el-Ghazal State
4,001
33
Warrap State
2,381
31
Upper Nile State
2,622
35
IDP Juba
3,603
17
Egypt
237
01
Key Findings:
The data from the table shows a steady increase in candidates over the past three years, with a significant jump in the 2023/24 academic year.
The number of male candidates has consistently been higher than that of female candidates.
Conclusion:
This increase in the number of candidates is a positive development for education in South Sudan. However, there is still a need to improve literacy rates in the country. The government should prioritise investing in education, including building more schools, hiring more teachers, and providing more resources to government-aided schools, especially supporting girls’ education. There should be more awareness campaigns to encourage parents to send their children, especially girls, to school. The government should work to address the ongoing conflict in the country, which has disrupted education and made it difficult for students to attend school in some fragile areas.
To ensure accuracy and transparency, we at 211 Checkwelcome corrections from our readers. If you spot an error in this article, please request a correction using this form. Our team will review your request and make the necessary corrections immediately, if any.
Fighting misinformation and disinformation in the media is crucial to avoiding fake news. Don’t share content you’re uncertain about. False information can harm and mislead people, risking their lives—Fact-check before sharing. For more details, visit https://211check.org/ or message us on WhatsApp at +211 917 298 255. #FactsMatter.
https://211check.org/wp-content/uploads/2023/11/Number-of-CSE-candidates-for-the-last-four-years.png575796211 Checkhttps://211check.org/wp-content/uploads/2020/03/211Check_logo-1-300x120.png211 Check2023-11-02 11:10:102023-11-02 11:10:13National Examinations Council sees a record-high 26.88% increase in secondary education exam registrations
No, the footage shows Putin arriving for the 2018 BRICS summit in South Africa and was aired by SABC News.
Writer: Ochaya Jackson
A viral Facebook post with a video showing Russian President Vladimir Putin supposedly arriving for the 2023 BRICS summit in South Africa is false.
The post, shared on 19 August 2023, reads: “President Putting has landed….. (sic).” The video shows Putin being received at the airport.
The claim, widely shared on Facebook and TikTok, appears to be footage aired by South Africa Broadcasting Corporation(SABC) News.
A keyword Search using the words “Putin arrives in South Africa for BRICS Summit” shows that the claim was shared widely.
In one instance, a TikTok user shared the video footage, claiming that the Russian President’s arrival for the BRICS summit in South Africa was a slap to the United States and the International Criminal Court (ICC).
“It’s a slap to the USA and ICC as Vladimir Putin arrives in South Africa for [the] BRICS Summit,” reads the claim text.
The screenshot of the TikTok claim
The Google Search result also returned a fact-check by RTL Today, debunking the same false claim.
Context:
The BRICS Summit is an international relations conference that brings together heads of state from the BRICS countries namely Brazil, Russia, India, China, and South Africa as a group of emerging economies. It was also attended by various heads of state or government officials from other countries around the world.
The claim regarding Putin’s arrival in South Africa surfaced ahead of the three-day 15th BRICS summit held from 22 August 2023 in South Africa.
Putin was supposed to attend the summit as a member of the BRICS. Still, the South African government announced on July 19, 2023, in a statement that the Russian president would not attend the summit, citing it as a mutual agreement.
Notably, the International Criminal Court, which South Africa is a member of, issued an arrest warrant against Putin in March 2023. The warrant subjects him to arrest in any member country of the Hague-based court.
A keyword search on “Putin arrives in South Africa” on YouTube returns the footage captured by SABC News. It was taken when the Russian President arrived for the 2018 BRICS summit in South Africa.
For the 2023 BRICS summit, Putin was represented by the Russian Foreign Affairs Minister Sergey Lavrov.
According to a media report, Putin addressed the audience at the summit via a video link but not in person.
Conclusion:
The video supposedly showing Putin arriving for the 2023 BRICS summit in South Africa is false. The video was taken by SABC News in 2018 when Putin attended the 10th BRICS summit hosted by South Africa.
To ensure accuracy and transparency, we at 211 Check welcome corrections from our readers. If you spot an error in this article, please request a correction using this form. Our team will review your request and make the necessary corrections immediately, if any.
It’s vital to fight misinformation and disinformation in the media by avoiding fake news. Don’t share content you’re uncertain about. False information can harm and mislead people, risking their lives—Fact-check before sharing. For more details, visit https://211check.org/ or message us on WhatsApp at +211 917 298 255. #FactsMatter.
https://211check.org/wp-content/uploads/2023/08/BRICS-PUTIN-False.png6281200211 Checkhttps://211check.org/wp-content/uploads/2020/03/211Check_logo-1-300x120.png211 Check2023-08-31 12:26:262023-08-31 12:26:33Fact-check: Did Russian President Putin arrive in South Africa for the 2023 BRICS Summit, as video footage shows?
South Sudan’s S4 2023 results reveal Central Equatoria State’s dominance in top-performing schools and the highest number of students, with notable success in the science category.
Writer: Stephen Topua
Brace yourself for an enlightening journey as we delve into a comprehensive analysis of gender-based achievements, state-level triumphs, and the schools that paved the way for success in the 2022/23 South Sudan Certificate of Secondary Education (CSE) examinations results.
This data story highlights the students’ performances in the recently released South Sudan Certificate of Secondary Education (CSE), also known as Senior Four (S.4) results. We look at the performance by gender, state and school.
The data used in the making of this data story is available here.
Feb 24, 2023, the Ministry of General Education and Instruction of the Republic of South Sudan released a press statement on the upcoming Certificate of Secondary Education (CSE) examinations for March 2023. Thirty-five thousand four hundred fifty-nine (35,459) students were registered to participate in the exams in three hundred ninety-eight (398) schools across the states and administrative regions.
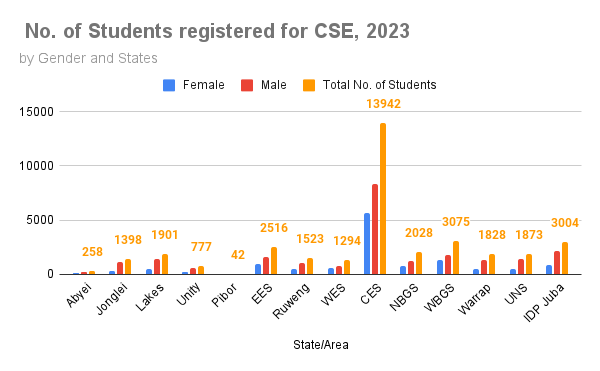
However, the total number of students who sat for the S4 results in 2023 was 28,916, with Central Equatoria State accounting for 13,901 students or 48% of the total student population.
Abyei and Pubor Administrative Region accounted for 255 and 38 students, respectively or a mere 1.01% of the total student population. This is highlighted in the chart below.
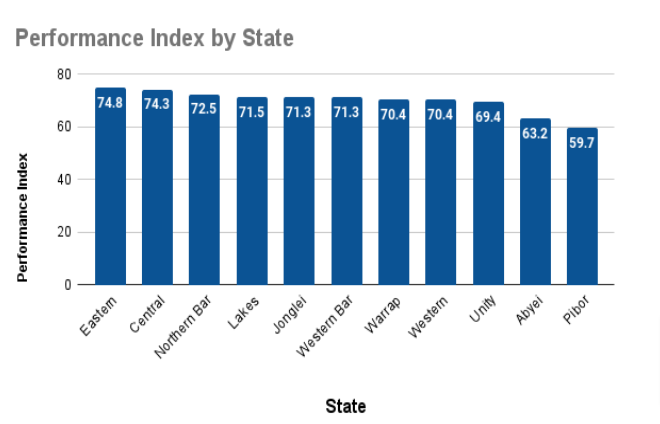
Results by State
South Sudan has ten (10) states and three (03) Administrative areas, and we analyse the results based on these parts. The results are highlighted below. We display the performance index of each State. Central Equatoria had the highest performance index of 74.8%, while Pibor Administrative Area, which also had the least number of students, had the lowest performance index of 59.7%. Unity State, Ruweng Administrative Area, IDP Juba and UNS are not represented in this data.
Top Performing Schools
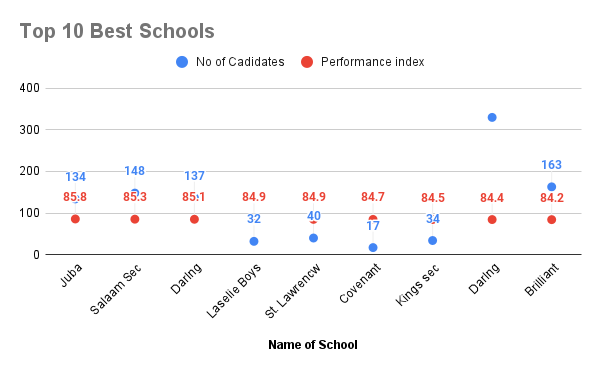
Of the best-performing schools, except one (01) – (Laselie Boys from Lakes) are from Central Equatoria State. Among the top 10, Juba Dioceseaen was the best in the country, with an index of 85.8, with 134 candidates. Among the top 10, Darling Wisdom Academy had the highest number of students, with a total of 330, while Covenant Progress had the least number of students, with a total of 17.
The average number of students among the top 10 schools is 115, with an average index of 84.867. this is illustrated in detail in the graph below
Top Performing Students
How was the performance of the students? We analyse that below.
In this section, we study several parameters:
Number of students in top 10 positions
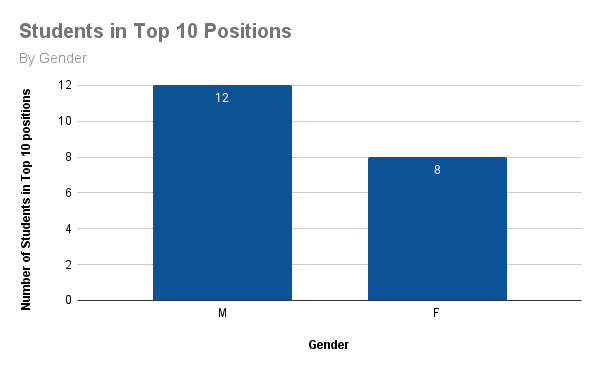
A total of twenty (20) students shared the top ten (10) positions, a total of twelve (12) gents and eight (08) ladies. All but one student was from the science section. The best student was from Western Bahr el Ghazal, while eighteen (18) were from Central Equatoria. Lakes was the other state with a representative in the second position.
A total of eight (08) schools were represented, with Brilliant Academy Secondary School having the highest number of students, a total of nine (09) out of twenty (20), or a whopping 45% of all students in the top 10 positions. This is represented below.
Performance of female students
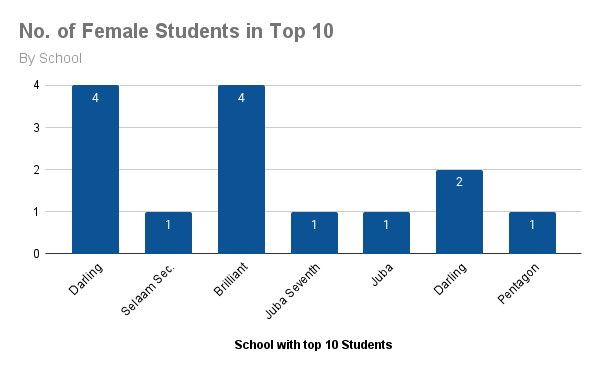
Fourteen (14) students shared the top ten (10) female student positions, all from Central Equatoria State. Only seven (07) schools have students on this list. Darling Wisdom Academy and Brilliant Academy each have four (04) students on this list, while four (04) schools have one (01) student each. This is illustrated in the chart below.
Conclusion:
One of the findings from this data story is that Central Equatoria State (CES) has the highest number of schools, and the top-performing schools are also from Central Equatoria State (CES).
The science category also produced the highest number of top-performing students, both in general and among female students. Many students were also sharing the top positions, indicating good performance among the top students.
To ensure accuracy and transparency, we at 211 Check welcome corrections from our readers. If you spot an error in this article, please request a correction using this form. Our team will review your request and make the necessary corrections immediately, if any.
https://211check.org/wp-content/uploads/2023/07/South-Sudan-S4-2023-Results-Google-Docs.png424660211 Checkhttps://211check.org/wp-content/uploads/2020/03/211Check_logo-1-300x120.png211 Check2023-07-28 14:14:382023-07-28 14:14:46South Sudan S.4 Results 2023: A Comprehensive Analysis of Performance by Gender, States, and Schools
Data literacy builds confidence and empowers individuals to achieve excellent outcomes without the need for significant technical skills.
Writer: Stephen Topua
Introduction
The future speaks data—do you? According to research by Forrester Consulting to Tableau, over 2000 managers and employees were surveyed about the importance of data literacy in their organizations; 70% of employees are expected to work heavily with data by 2025 — up from just a mere 40% in 2018
Data is omnipresent, generated by an ever-expanding array of sources, from personal devices to vast networks of interconnected systems. The abundance of data presents both opportunities and challenges. Individuals need to possess data literacy skills to harness the potential of data. According to Jordan Morrow, Author of Be Data Literate, data literacy is about creating comfort and confidence in utilizing data within the organization, and it doesn’t mean everyone has to become super technical or be something they are not. Still, it means everyone can drive results with data.
Definition
Data literacy is the ability to read, understand, create, and communicate data effectively. It goes above and beyond merely interpreting numbers; it involves critical thinking, data analysis, and contextual comprehension. In today’s data-driven world, comprehending, analysing, and effectively utilising data is becoming an increasingly crucial skill.
As a skill set, data literacy is vital in empowering individuals to make informed decisions, understand complex issues, and drive innovation across various domains. According to Dr Emily Johnson, a renowned data scientist and educator, “Data literacy is not just about knowing how to interpret charts and graphs; it goes beyond that. It’s about critically assessing data quality, identifying biases, and using data to make informed decisions.”
This highlights that data literacy is confined to technical skills and involves a broader understanding of data’s context and implications.
Important data terms:
Data Analysis: Examining, cleaning, transforming, and interpreting data to uncover patterns, trends, and relationships.
Data Visualization: The graphical representation of data to present complex information clearly and easily understandable.
Data Ethics: The moral principles and guidelines governing data’s responsible and ethical use, including data privacy and security considerations.
Data Quality: The accuracy, reliability, and consistency of data, ensuring it is fit for its intended purpose.
Data Collection: The systematic process of gathering raw data from various sources for analysis and decision-making.
Data Cleaning: Identifying and correcting errors, inconsistencies, and inaccuracies in data to improve its quality.
Data Privacy: Protecting individuals’ personal information from unauthorised access, use, or disclosure.
Data Security: Measures and practices put in place to protect data from unauthorised access, loss, or theft.
Data Governance: The overall management and control of data within an organisation to ensure data quality, security, and compliance.
Big Data: Huge and complex data sets that require advanced technologies and analytics for processing and analysis.
Machine Learning: A subset of artificial intelligence that enables computers to learn and improve from experience without being explicitly programmed.
Data Warehouse: A centralised repository that stores and organises large volumes of data from different sources for analysis and reporting.
Data Mining: The process of extracting valuable patterns and insights from large datasets using statistical and machine learning techniques.
Data-driven Decision Making: Using data and analysis to guide and support decision-making processes.
Open Data: Data that is freely available for anyone to access, use, and distribute.
Data Integration: Combining and harmonizing data from different sources creates a unified view.
Data Storytelling: The art of presenting data and analysis in a compelling and engaging narrative to communicate insights effectively.
Data Culture: an environment where decisions are consistently backed by data and everyone within the organization, regardless of their role, is encouraged and empowered to use data in their work. It is a culture of inquiry, curiosity, and data-informed decision-making.
Data literacy skills encompass various aspects. Firstly, it involves knowing which data is appropriate and relevant for a specific purpose, ensuring that the data selected aligns with the intended goal. Data literacy also entails understanding and interpreting data visualizations, and deriving insights and meaning from graphical data representations. Another crucial skill is the capacity to think critically about the information extracted through data analysis, evaluating its validity, accuracy, and potential limitations.
Being proficient in data literacy also means understanding data analytics tools and methods and knowing when and where to apply them to extract meaningful insights. It involves recognising instances where data may be misrepresented or used misleadingly, enabling individuals to identify and address any inaccuracies or biases within the data. Lastly, data literacy encompasses communicating data-driven information to individuals needing a more robust background in data literacy, employing effective data storytelling techniques to convey complex findings clearly and compellingly.
Importance of Data Literacy:
Data literacy is a skill that goes beyond the realm of data analysts and scientists. It is essential for everyone, from students to policymakers, to navigate the data-driven landscape effectively. Data literacy is not just about knowing how to use a spreadsheet or read a graph; it’s about developing a mindset that questions, explores, and derives insights from data. It empowers individuals to be informed decision-makers in an increasingly data-saturated world.
Data literacy is a key enabler of evidence-based decision-making. With the ability to comprehend data and draw meaningful conclusions, individuals can avoid making uninformed choices that may have adverse consequences.
Ways of improving your data literacy skills
There are various approaches to enhancing your data literacy skills. To begin, you might take advantage of online courses provided by companies such as Coursera and Udemy. These courses cover various topics, starting with fundamental data skills and advancing to advanced machine-learning techniques. It is also advised that you take an introductory statistics course to understand the underlying principles of data and analytics and a data visualization course to communicate data insights effectively.
To become more comfortable with data, you should study your company’s datasets using management dashboards or business intelligence tools. Take advantage of the opportunity to go into and investigate various reports for various periods. If your present role restricts your data access, don’t hesitate to request it. Finding a data mentor is another crucial step in increasing data literacy. This mentor does not have to be a data professional; anyone comfortable using the company’s reporting tools and making data-driven decisions could play this role.
If you’re concerned or believe you’re not naturally drawn to statistics, shifting your emphasis to the benefits of using data in your work can be beneficial. Recognise how data may help you better understand your target audience, uncover market gaps, enable better decision-making, support presentations with factual information, and wow your bosses. It is also critical to practice asking meaningful questions about the data you deal with. Understand the origins, validity, and any biases of the data. Exploring the topic of bias in data and artificial intelligence can be eye-opening and help you ensure that your organization’s decisions are based on accurate and fair facts.
Finally, don’t let fear or doubt stand in your way of achieving data literacy. Accept the opportunity to learn and improve, recognising that strengthening your data abilities will aid your professional development in various ways.
Conclusion:
Data literacy is fundamental in the data-driven era, shaping how individuals interact with information and make decisions. Data literacy becomes an indispensable skill for individuals to thrive in personal and professional domains as data grows exponentially. By embracing data literacy, individuals can transform data into knowledge, making informed decisions that positively impact their lives and society.
Data literacy is a critical skill set in our data-driven world. It empowers individuals to make informed decisions, contributes to organizational success, and improves various aspects of society, from education to healthcare. As we navigate an increasingly complex and data-rich landscape, fostering data literacy among individuals becomes paramount.
To ensure accuracy and transparency, we at 211 Check welcome corrections from our readers. If you spot an error in this article, please request a correction using this form. Our team will review your request and make the necessary corrections immediately, if any.
https://211check.org/wp-content/uploads/2023/07/Data-Literacy-Importance.png6281200211 Checkhttps://211check.org/wp-content/uploads/2020/03/211Check_logo-1-300x120.png211 Check2023-07-27 18:49:002023-07-28 06:52:36Explainer: Why South Sudanese should learn data literacy to harness the potential of data
No, the image under investigation was first published nearly ten years ago, depicting the extradition of a terrorism suspect from Sudan to Nigeria. However, the claim fails to specify the location or time of the incident referenced in the post.
Writer: Beatrice Amude Paulino
An image circulating on WhatsApp claiming that people should avoid consuming any products from the Pepsi Company for a few weeks due to an alleged incident where a worker supposedly added his HIV-infected blood to the beverages firm products is FALSE.
The image shows a man in handcuffs being escorted by police and is accompanied by a message stating that Sky News reported the incident.
A screenshot from the WhatsApp group describes the above situation.
Further investigation by 211 Check confirmed that the photo depicts Aminu Sadiq Ogwuche, who was arrested in Sudan and later extradited to Nigeria after the Nyanya bomb attack in Nigeria’s Federal Capital. According to the Nigerian site Premium Times, Ogwuche was handed over to the Nigerian police on 15 July 2014.
In another related finding, Vishvas News conducted a fact-check on 15 July 2020. It debunked a claim stating that the man in the photo contaminated Cadbury products with his alleged HIV-positive blood.
However, it’s important to note that according to the Centre for Food Safety and the World Health Organization, HIV cannot be transmitted through water or food because the virus does not survive long outside the human body. Additionally, if food contains a small amount of HIV-infected blood or semen, the virus is destroyed when exposed to air, heat from cooking, and stomach acids.
Elsewhere, the Centers for Disease Control (CDC) has indicated that the only case where food infected with HIV blood could potentially affect people is if a mother or caregiver who is HIV positive chooses to give pre-chewed food from their mouth to an infant.
Conclusion:
211 Check has found that the claim that a man put his HIV-infected blood in Pepsi products is false and misleading.
To ensure accuracy and transparency, we at 211 Check welcome corrections from our readers. If you spot an error in this article, please request a correction using this form. Our team will review your request and make the necessary corrections immediately, if any.
It’s vital to fight misinformation and disinformation in the media by avoiding fake news. Don’t share content you’re uncertain about. False information can harm and mislead people, risking lives—Fact-check before sharing. For more details, visit https://211check.org/ or message us on WhatsApp at +211 917 298 255. #FactsMatter
https://211check.org/wp-content/uploads/2023/07/Pepsi-HIV-False.png6281200211 Checkhttps://211check.org/wp-content/uploads/2020/03/211Check_logo-1-300x120.png211 Check2023-07-19 16:11:232023-07-19 16:11:31Fact-check: Does this photo show a man who added HIV- infected blood to Pepsi products?
This comprehensive analysis explores the history and determinants of the South Sudanese Pound’s exchange rate against the American Dollar, providing insights into its fluctuations and implications for the country’s economy.
Author: Stephen Topua
Introduction:
Currency exchange rates play a crucial role in international trade and financial markets, reflecting the value of one currency to another. This data story delves into the history of the South Sudanese Pound (SSP) and its exchange rate fluctuations against the mighty American Dollar (USD) since its introduction in 2012. We aim to provide valuable insights into the evolving relationship between the SSP and USD, shedding light on the factors influencing their exchange rate dynamics by analysing this trend over the past ten years.
South Sudan, a young nation that gained independence in 2011, introduced its national currency, the South Sudanese Pound, to establish its economic identity. Since then, the exchange rate between the SSP and USD has been a critical measure of the country’s financial performance and stability.
We use this trend to give a perspective of how this relationship has evolved over the last ten years until the present moment when the SSP is trading for over 900 for every USD.
Background:
Exchange rate: the exchange rate represents the price of a national currency valued as a foreign currency. When the exchange rate for a currency rises so that the currency exchanges for more of other currencies, it is referred to as appreciating or “strengthening.” When the exchange rate for a currency falls so that it trades for less than other currencies, it is referred to as depreciating or “weakening.
How are exchange rates determined?
Exchange rates, which reflect the value of a country’s currency to other currencies, are influenced by various factors. Inflation, interest rates, public debt, political stability, and economic health all play crucial roles in shaping the strength or weakness of a currency. Countries with low inflation rates and stable political environments tend to have stronger currencies, as they attract investors and inspire confidence. Additionally, a robust economy, positive balance of trade, and low current account deficits contribute to a currency’s appreciation. However, speculative activities and short-term market sentiments can also affect exchange rates.
Understanding these determinants helps in analyzing and predicting currency movements. Knowledge of these factors is vital for businesses, investors, and policymakers in making informed decisions in the global financial markets. It is important to monitor inflation rates, as low inflation tends to support stronger currencies. Interest rates influence the attractiveness of a currency to investors, and higher rates can strengthen exchange rates. Public debt levels, political stability, and economic health also impact exchange rates. Finally, trade balance and current account deficits affect a country’s currency value. By considering these determinants, stakeholders can navigate the complex world of foreign exchange and adjust their strategies accordingly.
Types of exchange rate systems:
There are four main types of exchange rate regimes. The first is the free-floating system, where exchange rates fluctuate constantly based on market demand and supply. Currency prices change dynamically, reflecting the forces of the foreign exchange market.
The remaining three types include fixed, pegged, and managed float systems. In the fixed system, a monetary authority sets a firm exchange rate for the currency to a foreign currency or a basket of currencies. This fixed rate remains constant over time. Under the pegged system, a country ties the value of its currency to a foreign currency or a specific unit of account. Although bilateral parity is maintained, the value of the home currency fluctuates in line with the anchor country’s currency. In the managed float system, the exchange rate is influenced by both market conditions and interventions by the monetary authority. The central bank actively participates in the foreign exchange market to manage and steer the exchange rate without committing to a predetermined path.
Understanding these various exchange rate systems is crucial for comprehending the dynamics of international trade and financial markets. Each system offers different degrees of flexibility and control over a country’s currency value, shaping economic outcomes and policy decisions.
The United States of America vs South Sudan Economies by Comparison:
The GDP is the market value of all final goods and services produced within a country in a given period. For comparison purposes, The GDP of both the USA and South Sudan are:
USA: 26.24 trillion USD
South Sudan: 7.02 Billion USD
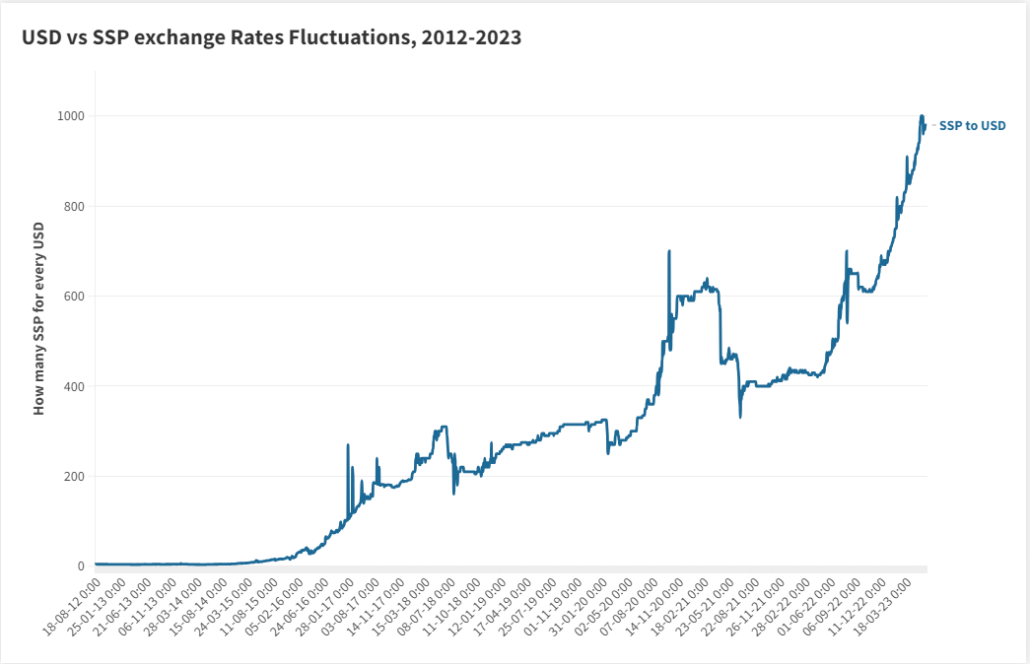
Evolution in the exchange rate of the South Sudanese Pounds (SSP) versus the United States Dollars (USD)
At the inception, the exchange rate was SSP 2.75 for every 1 USD. However, things quickly went downhill as the exchange rate is currently at 980 SSP for every 1 USD within years, peaking at 1001 SSP for every USD. This is highlighted by the graphs below.:
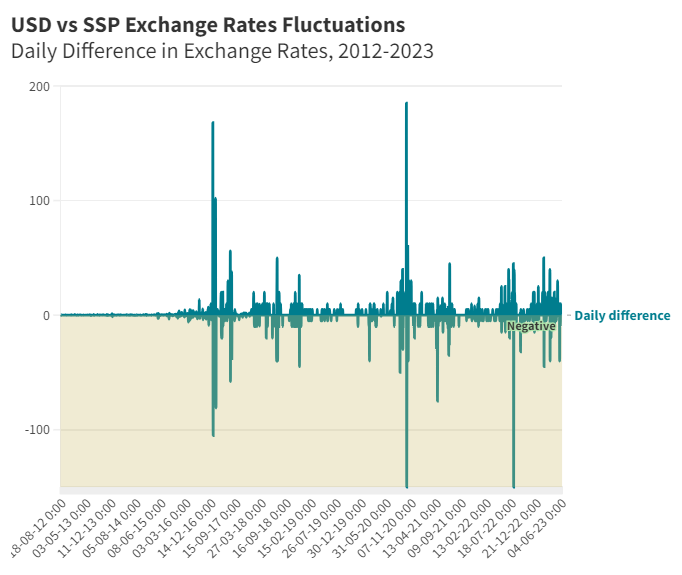
The first graph shows how the exchange rates have evolved between 2012 and 2023, offering the highs and lows in the process. The second graph displays daily changes in the exchange rates, showing drastic daily changes in the process, such as the highest daily exchange rate, highest gain and highest loss in value by the SSP on the United States dollar.
The link to the visualisation showing the daily difference in the exchange rate is given Here
Some insights emerge from the data, which we highlight below:
The most significant loss in value for the SSP against the USD was between 12 and 13 October 2020, when it went from 515 to 700 in a matter of 24 hours
The biggest gain in value for the SSP against the USD was between 13 and 14 October 2020 and between 6 and 7 August 2022, when it went from 700 to 550 in a matter of 24 hours
The highest-ever exchange rate was on 24 May 2023, when it stood at 1001 SSP for every USD
How do search terms related to Exchange rates compare in South Sudan for the past 12 months?
In conclusion, we compare how searches are compared for four related topics: South Sudanese pound, USD, BoSS, exchange rate and FOREX. For this segment, we use Google Trends for the data collection and visualisation. Google Trends is a website by Google that analyzes the popularity of search queries in Google Search across various regions and languages. The website uses graphs to compare the search volume of different questions over time. We use this feature to analyse how the search patterns of the four topics emerge from July 2022 to June 2023.
The graph below shows interest over the past 12 months. The research shows that USD is consistently the most searched term, indicating considerable interest in USD in the country. All the data was collected using GoogleTrends.
The graph below shows that the USD generated the most interest in the period lasting 12 months, followed by Exchange Rate. In contrast, BoSS and the SSP showed little interest in search volumes in the analysed period.
NB: the data was visualised using Datawrapper.
This comprehensive analysis explores the South Sudanese Pound’s history and its exchange rate fluctuations against the American Dollar over the past decade. Factors influencing exchange rates, such as inflation, interest rates, public debt, political stability, economic health, balance of trade, and confidence/speculation, are discussed. The four main types of exchange rate regimes—freely floating, fixed, pegged, and managed float—are explained, highlighting their characteristics and implications. The article emphasizes the importance of understanding these determinants and exchange rate systems for businesses, investors, and policymakers to make informed decisions in the global financial markets. We also examined search trends related to exchange rates in South Sudan, indicating significant interest in the United States Dollar while providing valuable insights into the complex dynamics of exchange rates and their impact on economies.
To ensure accuracy and transparency, we at 211 Check welcome corrections from our readers. If you spot an error in this article, please request a correction using this form. Our team will review your request and make the necessary corrections immediately, if any.
https://211check.org/wp-content/uploads/2023/06/Untitled-Visualisation-Flourish-1.png6741045211 Checkhttps://211check.org/wp-content/uploads/2020/03/211Check_logo-1-300x120.png211 Check2023-06-28 11:39:582023-06-28 11:40:07South Sudanese Pound’s Rollercoaster Ride: Analyzing its exchange rate journey against the Dominant American Dollar
This article discusses Distributed Denial of Service (DDoS) attacks, how they can be prevented and mitigated, and their potential impact on businesses.
Writer: Jibi Moses
Distributed denial of service (DDoS) attacks are now everyday occurrences. Whether a small non-profit or a huge multinational conglomerate, the organisation’s online services—email, websites, anything that faces the internet—can be slowed or completely stopped by a DDoS attack. For data centres, colocation, hosting and other service providers, DDoS attacks threaten the infrastructure that provides network and service availability to all its tenants, subscribers and customers and can target the most valuable customers.
A successful DDoS attack can seriously damage a brand’s reputation and cost hundreds or even millions of dollars in revenue. Moreover, DDoS attacks are sometimes used to distract cybersecurity operations while other criminal activity, such as data theft or network infiltration, is underway.
A Denial-of-Service (DoS) attack shuts down a machine or network, making it inaccessible to its intended users. DoS attacks accomplish this by flooding the target with traffic or sending it information that triggers a crash. Some definitions of the DoS can be found here,here, here and here.
Network traffic is the data moving across a computer network at any given time. Network traffic, also called data traffic, is broken down into data packets and sent over a network before being reassembled by the receiving device or computer. In the case of an attack, keep sight of the other hosts, assets, or services residing on your network.
Meanwhile, a Distributed denial-of-Service (DDoS) attack is a DoS attack that uses multiple computers or machines to flood a targeted resource. Both attacks overload a server or web application, intending to interrupt services.
Many attackers conduct DoS or DDoS attacks to deflect attention away from their intended target and use the opportunity to conduct secondary attacks on other services within your network.
All the above affect the victim(s) differently but with a similar intention of disrupting the user. However, this doesn’t give the attacker access to the website he/ she has attacked.
A recent example of a DDoS attack in South Sudan was the attack on the Bank of South Sudan site. The local media was awash with the news, as reported by Eye Radio, CityReview, and Sudan Post, A mysterious group calling itself Anonymous South Sudan, claimed responsibility of the attack, citing high inflation rates as the main reason for hacking the bank’s website. Calling for a drop in the wanted South Sudanese Pounds exchange rate to 400 SSPP per 1 USD.
Meanwhile, Denial of Service should be distinct from Hacking. According to Malwarebytes: Hacking refers to activities that seek to compromise digital devices, such as computers, smartphones, tablets, and even entire networks. And while hacking might not always be for malicious purposes, nowadays, most references to hacking, and hackers, characterise it/them as unlawful activity by cybercriminals—motivated by financial gain, protest, information gathering (spying), and even just for the “fun” of the challenge. Another point is that hackers have total control of the site or whatever they have broken into, unlike DDoS, whereby the system is flooded with traffic to interrupt the system. However, DDoS is one of the many tools for hacking.
Prevention:
DDoS (Distributed Denial of Service) attacks can be challenging to prevent completely, but there are several measures that you can take to minimise their impact. Here are some steps to stop a DDoS attack on your website:
Use a DDoS protection service: Consider using a third-party DDoS protection service to detect and mitigate attacks in real-time.
Increase your server capacity: DDoS attacks can cause your website to become unavailable due to overwhelming traffic. Increasing your server capacity can help your website handle the traffic and remain available during an attack.
Use a CDN (Content Delivery Network): A CDN can help distribute the traffic to multiple servers and reduce the load on your website, making it more resilient to DDoS attacks.
Configure your firewall: Configure your firewall to block traffic from known malicious IP addresses, limit connections from a single IP address, and filter traffic based on specific patterns common in DDoS attacks.
Keep your software up to date: Regularly update your website software, including the operating system, web server, and any third-party applications, to ensure that they are free from known vulnerabilities that could be exploited in a DDoS attack.
Monitor your traffic: Analyze your traffic logs to identify any unusual traffic patterns that could indicate a DDoS attack. Using a monitoring tool can help you detect attacks early and take steps to mitigate them.
Have a DDoS response plan: Develop a DDoS response plan that outlines the steps you will take in the event of an attack. This should include procedures for notifying your hosting provider, engaging a DDoS protection service, and communicating with your users.
What next if attacked?
Resolving a DDoS attack can be challenging, but there are several steps you can take to mitigate its effects: Identify the source of the attack: Determine where the attack is coming from and which systems or machines are being used to launch it. Block traffic from the attacking IPs: Once you know where the attack is coming from, block all traffic from those IP addresses to your network or website. Filter traffic: Apply filters to incoming traffic to identify and block malicious traffic and allow legitimate traffic. Increase server capacity: Add more servers or bandwidth to handle the increased traffic load. Use a Content Delivery Network (CDN): A CDN distributes network traffic across multiple servers, reducing the attack’s impact on any one server. Contact your Internet Service Provider (ISP): Your ISP may have tools or resources to help you mitigate the effects of a DDoS attack. Implement DDoS protection software: Several commercial and open-source options are available to help prevent DDoS attacks.
Remember that preventing DDoS attacks before they occur is the best strategy. It’s important to stay vigilant and keep your security measures up-to-date to reduce the risk of a successful attack.
To ensure accuracy and transparency, we at 211 Check welcome corrections from our readers. If you spot an error in this article, please request a correction using this form. Our team will review your request and make the necessary corrections immediately, if any.
https://211check.org/wp-content/uploads/2023/05/A-featured-WordPress-site-image.png6281200211 Checkhttps://211check.org/wp-content/uploads/2020/03/211Check_logo-1-300x120.png211 Check2023-05-04 06:49:412023-05-04 06:49:48Explainer: Distributed Denial of Service Attack (DDoS Attack)
The survey is expected to be an essential resource for the government’s development planning, decision-making, and provision of services as it provides the latest accurate population estimates and other demographic and socio-economic characteristics of the inhabitants.
Writer: Jibi Moses
The National Bureau of Statistics (NBS) in South Sudan released the Population Estimation Survey 2021 (PES) on April 6th, 2023, revealing a surge in the country’s population to 12.4 million people, a rise of over four million people. The PES 2021 was conducted between May 28th and June 15th, 2021, across ten states and three Administrative areas, with a female population of 52.9% and a male population of 47.1%, while the youth population stands at 77%.
The PES 2021 is expected to be an essential resource for the government’s development planning, decision-making, and provision of services. The survey will monitor the performance of the National Development strategy and the sustainable development goals while providing policymakers with briefs and reference points for research.
With South Sudan’s last census conducted in 2008, the PES 2021 provides the latest accurate population estimates and other demographic and socio-economic characteristics of the inhabitants. The NBS utilised satellite imagery and enumeration to ensure the quality of information and data for the survey met the basic assumptions of the analytic method.
Despite the impact of civil war outbreaks since independence in 2011, the PES 2021 provides a comprehensive and up-to-date representation of South Sudan’s population, enabling policymakers and decision-makers to implement evidence-based planning and decision-making for progress and sustainable development in the country.
The country’s last Census was in 2008, when it was still an autonomous region of Sudan. While releasing the results, Isaiah Chol Aruai, the chairperson of NBS, explained that the figures are based on satellite imagery and enumeration across ten states and three Administrative areas.
“The quality of information and data for a given locale, as well as the ability of the data to meet the basic assumptions of the analytic method, are key to performing accurate estimates or projections,” Isaiah Chol Aruai said.
National statistical offices often produce estimates and projections of various characteristics of a population. These statistics are a vital source of information for decision-makers throughout the government, the private sector, and civil society. An estimate calculates a population’s size or distribution or another population characteristic for the present or past. At the same time, a projection describes these characteristics in the future.
In most countries, policymakers and other data users often require accurate information between census data releases every ten years. Although a full population count only occurs during a census, statistical methods and tools often produce regular, up-to-date population estimates.
Population estimates can describe the population size and demographic characteristics such as age, sex, or education level. Population estimates depend on change’s demographic components: mortality, fertility, and migration.
Estimates of mortality, fertility, and migration estimates are derived from data available from censuses, surveys, registration systems, and other administrative records. Estimates and projections are calculated similarly. However, estimates employ observed data and hypotheses of demographic change when data are incomplete. Projections, on the other hand, rely on hypotheses about demographic change in the future.
One of the most widely used approaches for producing population estimates and projections is the Cohort Component Method, which can be used to calculate detailed statistics such as population by age and sex, total fertility rate, infant mortality rate, and population growth rate. A population may also be estimated and projected for multiple geography units, from the national to various subnational levels (e.g.States, Counties, Districts, Payams, Bomas).
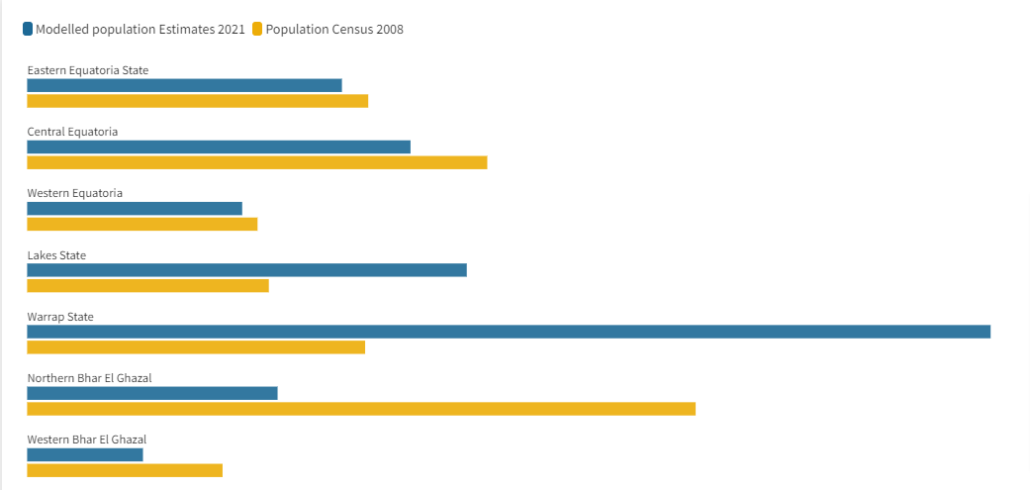
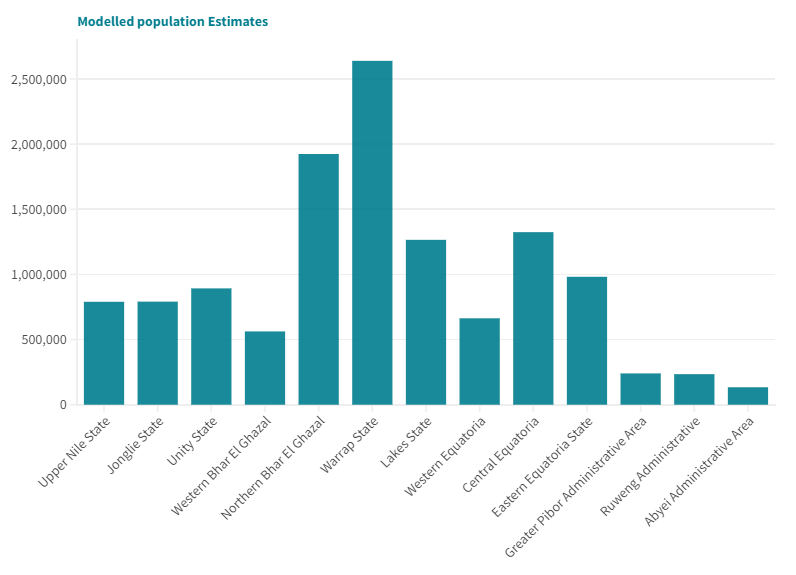
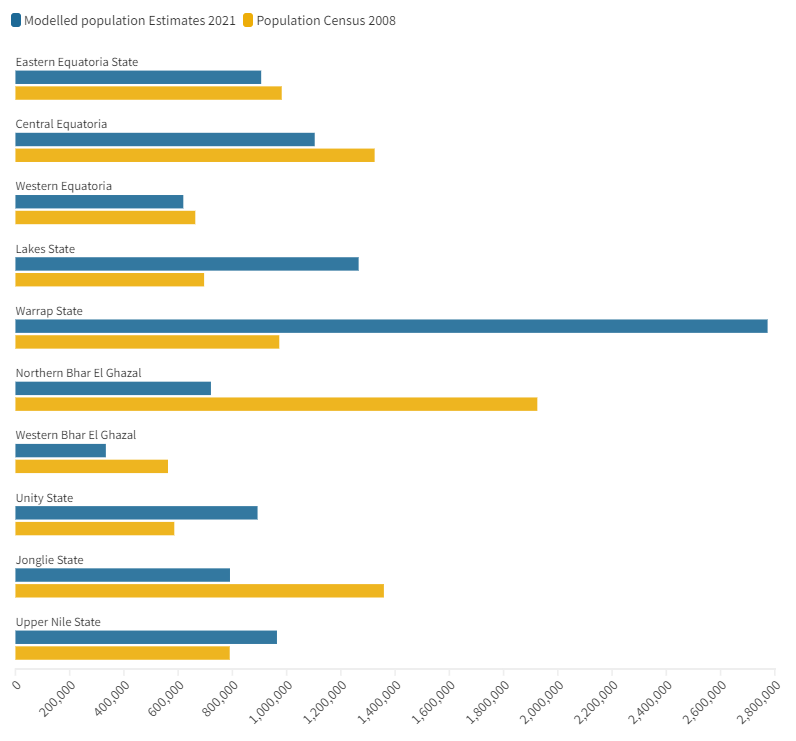
Figure 2: A bar chart showing the total populations from the ten states and the administrative Areas | Source: Flourish Studio Data Visualization
Fig 3. A stacked bar chart showing the figures of the two most recent population census in 2008 and the PES 2021 | Source: Flourish studio data visualization.
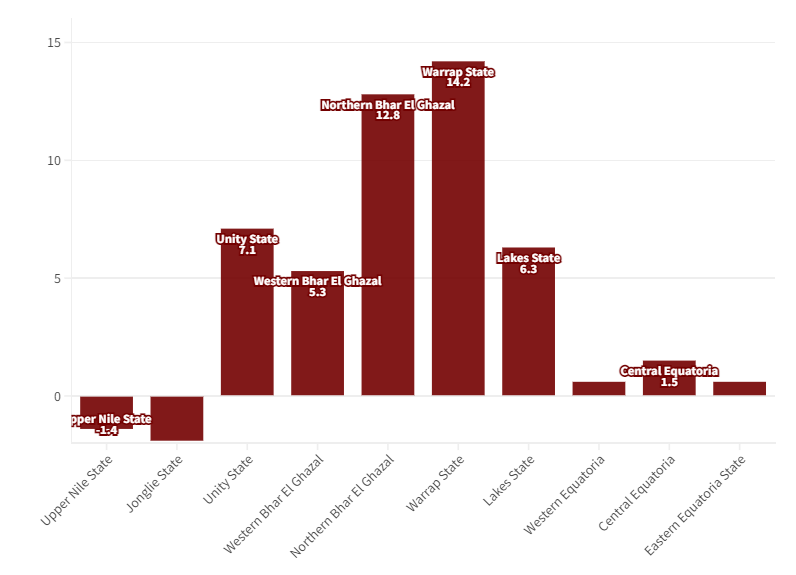
Fig 4: A bar chart showing the population percentage between the two censuses, 2008 and PES 2021 | Source: Flourish Studio Data Visualization
Criticisms from the Public:
The PES 2021 report was received with much scepticism and criticism from the public. Individuals and organisations criticised the authenticity of the data. Some voices challenging the report can be found in this article by The East African and an analysis by The Sudd Institute.
“Some opposition politicians and some in the civil society questioned the estimates that put the total of the country’s population to 12,444,018 and are demanding what they term “a proper census” as per the 2018 peace agreement. UN estimates had put the population at 11,556,069 even though the UN itself partly supported the current survey,” reports The East African
Augustino T. Mayai, the Managing Director of the Sudd Institute, an independent research organisation, analysed the scientific, political, and policy implications of the PES results stating that the new estimates are in stark contrast with South Sudan’s 2008 census counts, which stood at 8.26 million, informing the 2010 regional and national elections. These estimates, he says, “…have so far generated heated debates in various quarters, with many outright contesting them for a host of good reasons.”
However, on the 13th of April, NBS clarified that the PES 2021 results should not be used for electoral purposes, Juba Echo, but for planning and policy guidance, such as Something Augustino T. Magai questions.
‘’…if the PES results cannot be used for electoral purposes, then it is odd to use them
for development. Using the scientifically troubled PES results for development (i.e.,
distributing services) is more problematic than using them for politics. This is because
development is for the ‘greater good for a greater number of people,’ as should be obvious,
South Sudan’s politics benefits a select few. Let me illustrate. Suppose the Northern Bahr el Ghazal government constructs 50 new schools in Aweil East based on the current estimates, subsequently recruiting teachers and enrolling students. It then dawns on the government that only ten such schools must be based on actual enrollments. The result then boils down to resources wasted and injustice inflicted on populations that genuinely deserve the services but could not get..,’’ as quoted in his report.
Conclusion:
Much as the PES 2021 results announced, NBS decried a lot of challenges in bringing out accurate and perfect results; among these, they cited the insecurity in parts of the country, floods that had submerged a lot of the inhabited land areas, lack of resources both financial and human. However, against all odds, they could still get the necessary data.
The PES 2021 results put the current estimated population at 12,446,016, with an increment of 4,186,335 from the 2008 population census, which had the country at 8,260,490. This shows an annual percentage growth of 3.9%.
The current population of South Sudan is 11,556,786 as of Tuesday, April 25th 2023, based on the latest United Nations data. With 43% of the population below 14, 54% between 15 – 64 and 3% representing 65 and above.
Population estimates are a vital source of information for decision-makers throughout the government, private sector, and civil society. In most countries, policymakers and other data users often require accurate information between census data releases every ten years. Although a full population count only occurs during a census, statistical methods and tools often produce regular, up-to-date population estimates.
Demographic components such as mortality, fertility, and migration must be considered to ensure the accuracy of population estimates. Estimates of these components are derived from data available from censuses, surveys, registration systems, and other administrative records. The Cohort Component Method is widely used for producing population estimates and projections.
Given the importance of accurate population estimates, it is recommended that South Sudan conducts regular surveys and censuses to ensure policymakers have the necessary information for decision-making. Innovative methods such as satellite imagery and enumeration can enhance the quality of information and data collected during surveys and censuses. Policymakers should prioritise evidence-based planning and decision-making for progress and sustainable development in South Sudan.
This article is part of our data stories work written with the firm belief that factual and data-driven reporting can influence decision-making and public perceptions and educate the audience on public interest issues.
To ensure accuracy and transparency, we at 211 Check welcome corrections from our readers. If you spot an error in this article, please request a correction using this form. Our team will review your request and make the necessary corrections immediately, if any.
https://211check.org/wp-content/uploads/2023/04/Comparison-between-PES2021-and-2008-population-census-_-Flourish.png4951041211 Checkhttps://211check.org/wp-content/uploads/2020/03/211Check_logo-1-300x120.png211 Check2023-04-29 11:57:252023-04-29 11:57:31Data Story: South Sudan’s population surges to 12.4 million, reveals 2021 survey
We may request cookies to be set on your device. We use cookies to let us know when you visit our websites, how you interact with us, to enrich your user experience, and to customize your relationship with our website.
Click on the different category headings to find out more. You can also change some of your preferences. Note that blocking some types of cookies may impact your experience on our websites and the services we are able to offer.
Essential Website Cookies
These cookies are strictly necessary to provide you with services available through our website and to use some of its features.
Because these cookies are strictly necessary to deliver the website, refusing them will have impact how our site functions. You always can block or delete cookies by changing your browser settings and force blocking all cookies on this website. But this will always prompt you to accept/refuse cookies when revisiting our site.
We fully respect if you want to refuse cookies but to avoid asking you again and again kindly allow us to store a cookie for that. You are free to opt out any time or opt in for other cookies to get a better experience. If you refuse cookies we will remove all set cookies in our domain.
We provide you with a list of stored cookies on your computer in our domain so you can check what we stored. Due to security reasons we are not able to show or modify cookies from other domains. You can check these in your browser security settings.
Other external services
We also use different external services like Google Webfonts, Google Maps, and external Video providers. Since these providers may collect personal data like your IP address we allow you to block them here. Please be aware that this might heavily reduce the functionality and appearance of our site. Changes will take effect once you reload the page.
Google Webfont Settings:
Google Map Settings:
Google reCaptcha Settings:
Vimeo and Youtube video embeds:
Privacy Policy
You can read about our cookies and privacy settings in detail on our Privacy Policy Page.
 211 Check Website Graphics